YOLOX
Dashboard PRO
Computer Vision Analytics Dashboards are a Game Changer.
Build a Full-Stack end-to-end RTSP Dashboard in 14 days!
ENROLL IN COURSEThe Problem
To develop an end-to-end Computer Vision application, for your client, you have 2 Options:
- Use a Third-Party Online Service
- Develop the Dashboard Yourself
Online Service
Pros
- Quick to build & Deploy
Cons
- Expensive Monthly Cost
- Limited Models & Functionality
- Not Privacy focused

Build it Yourself
Pros
- Can deploy anywhere
- Feature rich, flexible
- Use any model, library
- No Monthly costs
- Not hosted on 3rd Party - Thus data is private & Secure
Cons
- Need to have programming background
- Not many tutorials/courses on how to build CV Dashboards.
YOLOX Dashboard PRO
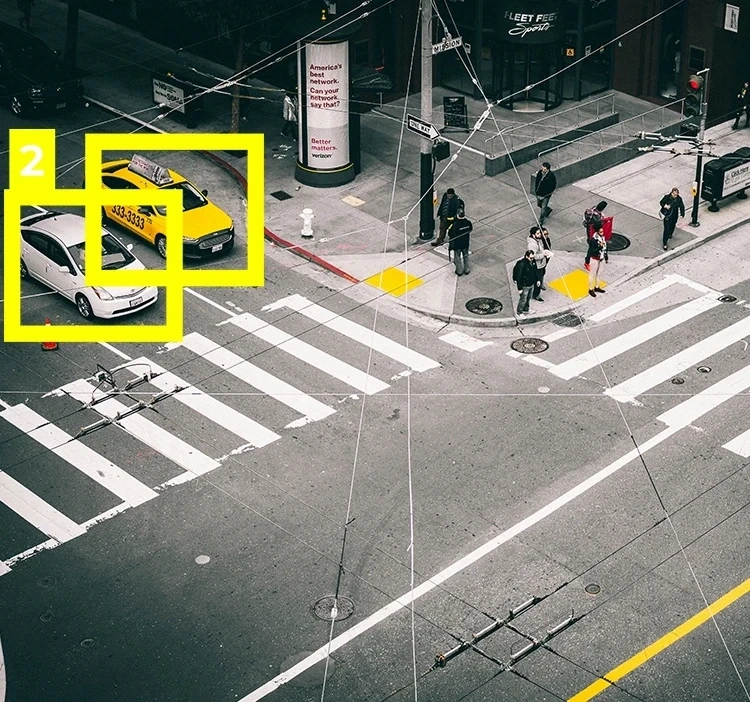
Build a Full-Stack Deployable Traffic Analytics Dashboard
from Scratch using YOLOX


Code

8 Hours+ Content

Beginner Friendly

Lifetime Access
YOLOX is Fast!
3.8%
More Accurate than YOLOv5
66%
Faster than EfficientDet
"If you want to develop your own Deployable Vision Dashboard without being tied to costly & limited 3rd Party Services & Customize your Dashboards the way you want it, then this course is for you!"
Curriculum
Module 1
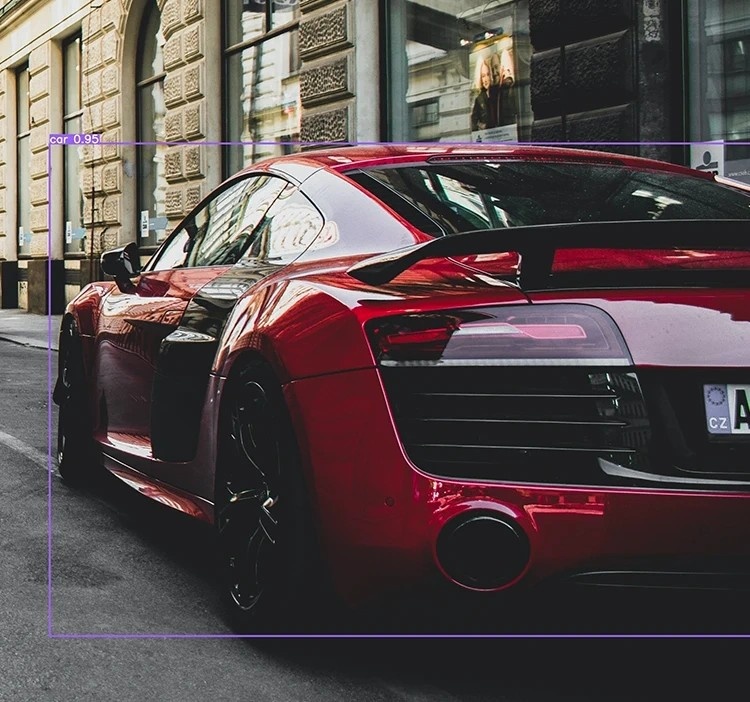
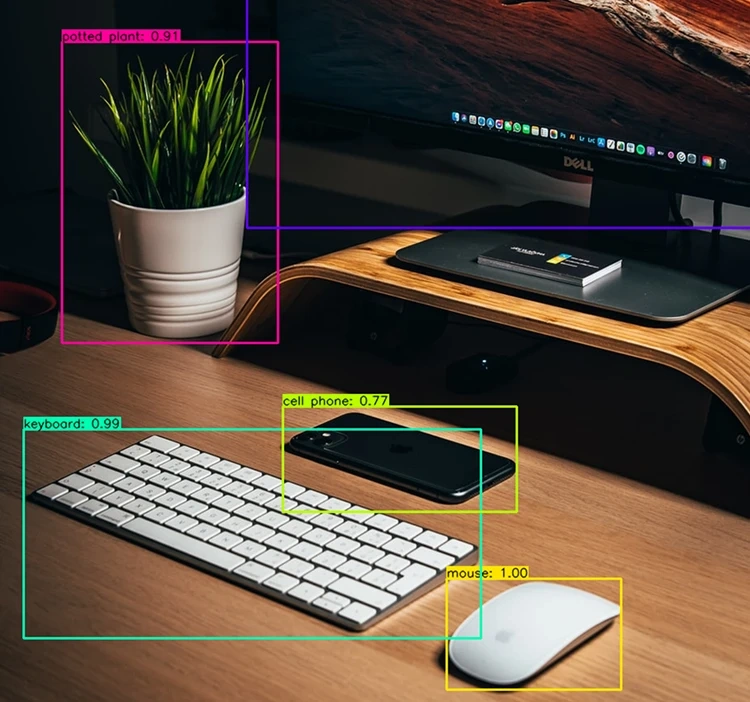
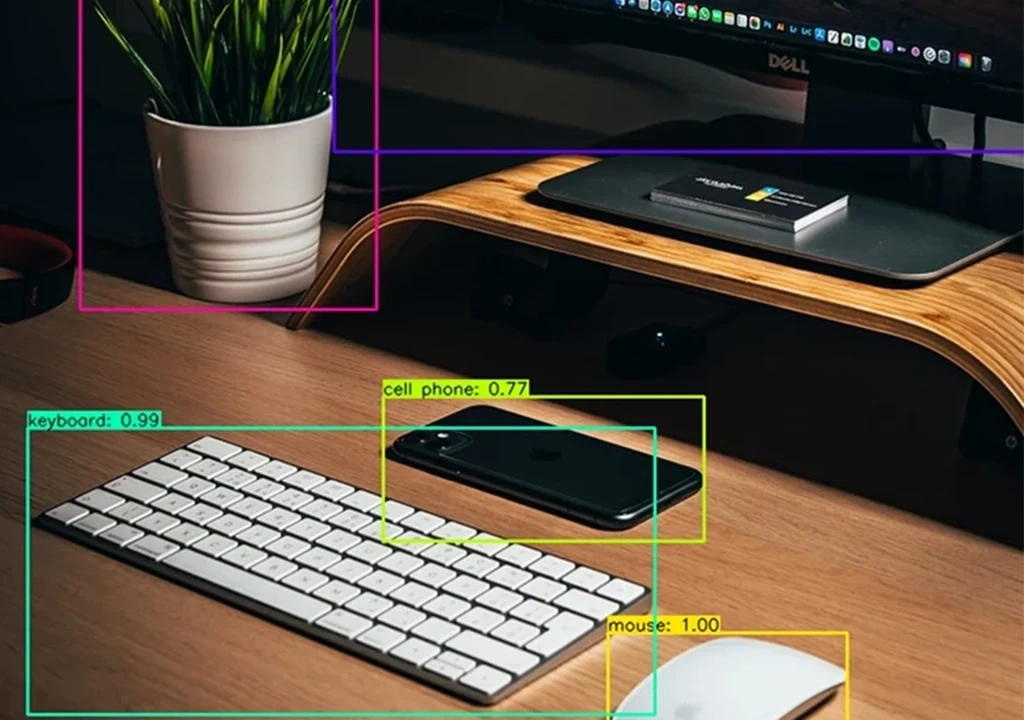
Object Detection
YOLOX Basics
- Introduction to YOLOX
- YOLOX Paper Review
- Loss Function
- Evaluation Metrics
- Intersection Over Union
- Non-Max Suppression
- Mean Average Precision
- YOLOX on Video/Image
- YOLOX Live Inference
Module 2
Training Custom YOLOX
- Data Collection
- Data Augmentation
- Dataset Bias & Health
- How to tune your training parameters
- How to analyze your model performance
- Active learning for faster automated annotation
Module 3+4
YOLOX + Tracking
- Object Tracking Basics
- SOTA exploration and Paper Review
- Implementing Basic Tracking Architecture
- Multi-Object Tracking (MOT)
- Integrating YOLOX with SORT
- App 1- Detect & Track Vehicles
- App 2 - Count & Sort Vehicles
- App 3 - Identify Direction Trajectories
- App 4 - Speed Calculation
- Track from LIVE RTSP Camera
Module 5
Traffic Flow Dash App
Build a Full-Stack Vision Analytics Dashboard
- Dashboard Basics
- Plotly Dash fundamentals
- Dash User Interface Planning
- HTML Elements
- Dash Core Components
- Visualizations - UI Widgets
- Visualizations - Graphs
- Visualizations - Pie Charts & Sunburst Charts
- Bootstrapping Dash
- Layout Design & Styling
- Putting it all together - YOLOX + Tracking Inference Integration in Dashboard
- Enhancing the Dashboard
- Deploy Solution
The Dashboard

Modern UI
Upgrade
Dashboard Features
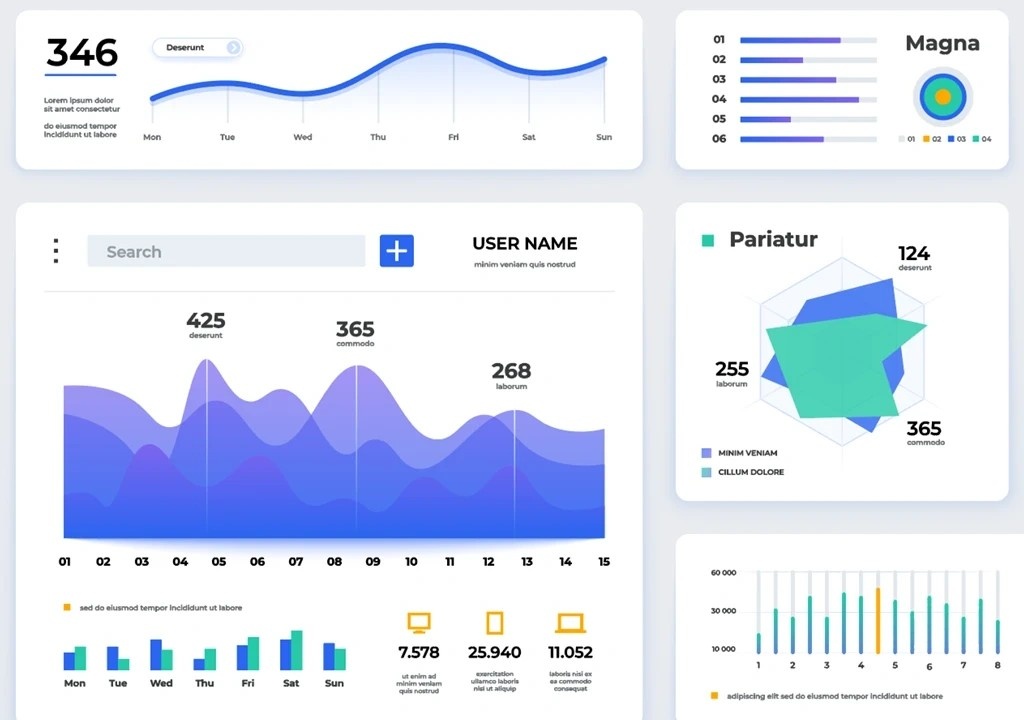
Graph / Charts
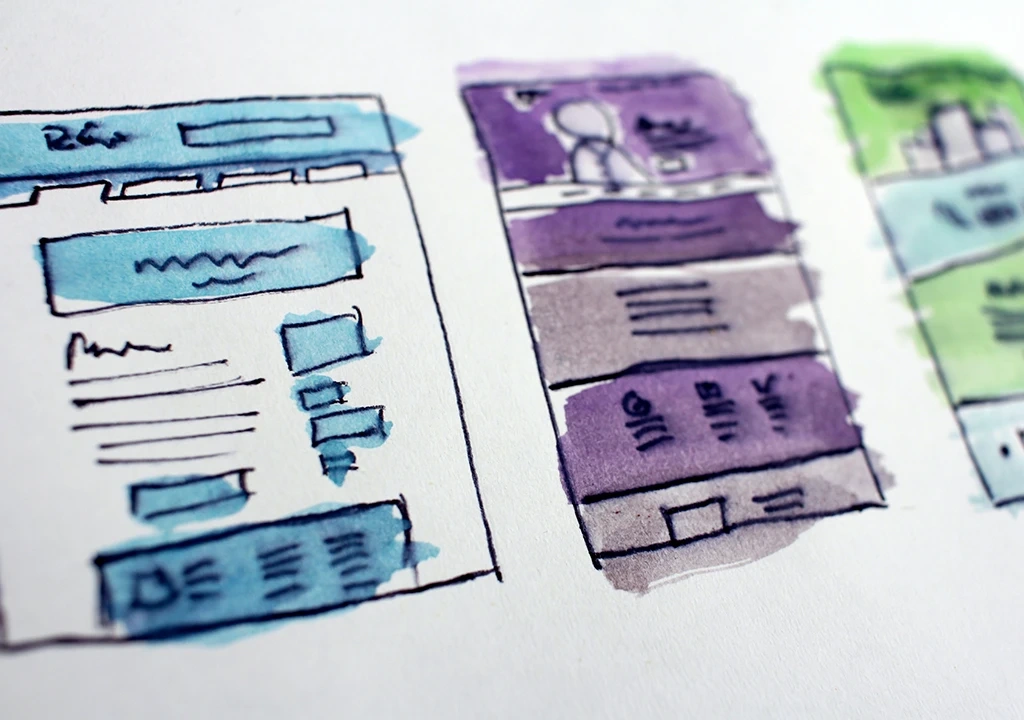
User Interface Design & Development

Interaction Widgets

Web App Deployment

Heatmaps

Speed Trajectory Calulcations
Class Selection
Multi-RTSP Cameras [$10k Goal]
Bonuses


Certification
Once you complete the course, you will graduate with an Official Certificate embedded with a unique ID that you can share on LinkedIn.
Your Instructors
Ritesh Kanjee
-
100k+ Subscribers YouTube
-
71k Students Augmented Startups
-
M(Eng.) Electronic University of Joburg
-
13k+ Followers LinkedIn
Rohit Kukreja
-
Deep Learning & CV Expert
-
Data Analyst
-
Freelancer & Lecturer

Pricing

It will cost you:
$2938+
Without this Course, to hire a developer to build a dashboard for you. That is 73+ hours at $40 per hour.
$399
By enrolling in this course, you save thousands of dollars and you are able to develop custom dashboards for your own clients.

FAQ
When will the Course be Released
Will I have lifetime access to this course?
What happens once I buy this course?
This course is WRONG for you if…
This course is RIGHT for you if…
“Price is too much I can’t afford it…”
Should I enroll if I'm a beginner?
Should I enroll if I am a seasoned developer?
Why do I have to pay for YOLOX?
What GPUs do you recommend for the course?
Can I use AMD or any other GPU card?
Why code in Python?
Which Option should I choose?
Which Operating System is this course for?
Will I learn how to build YOLOX from scratch?
I have another question.
Will I receive a certificate for this training?
Is there a Refund Policy?
Still Have Questions?
Contact me
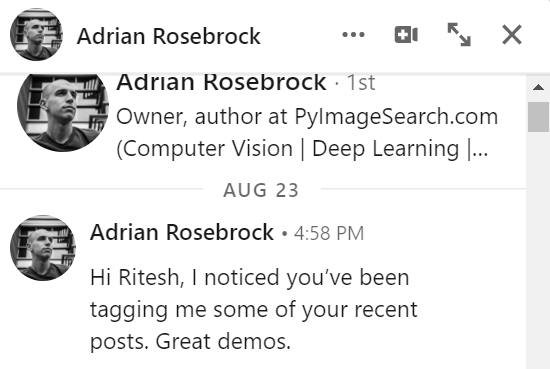
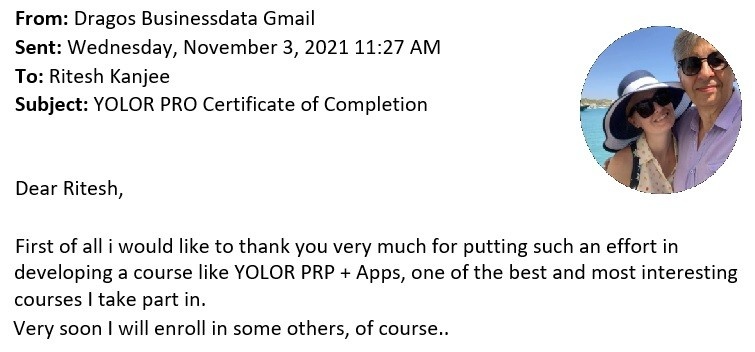
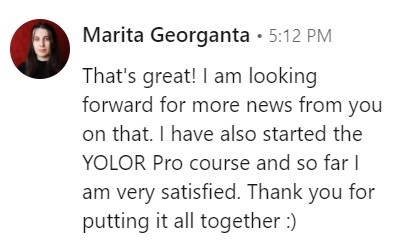
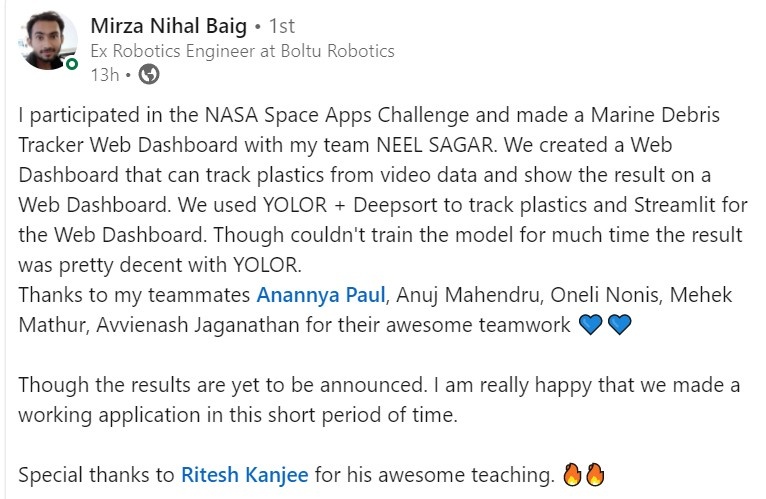
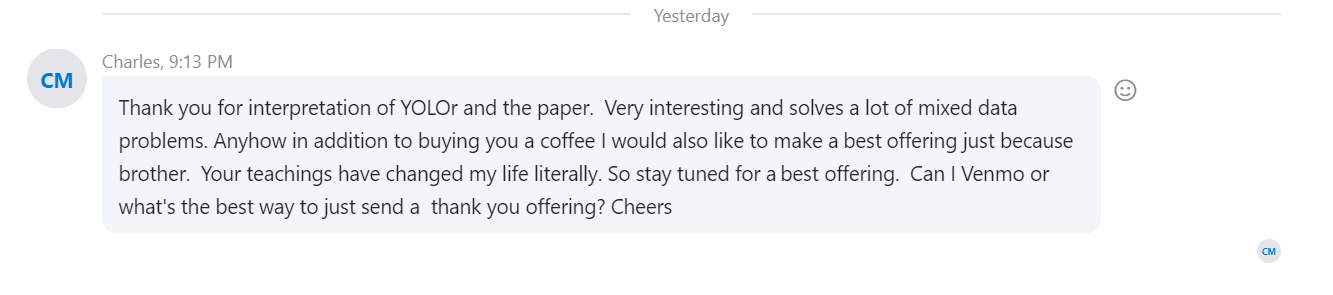
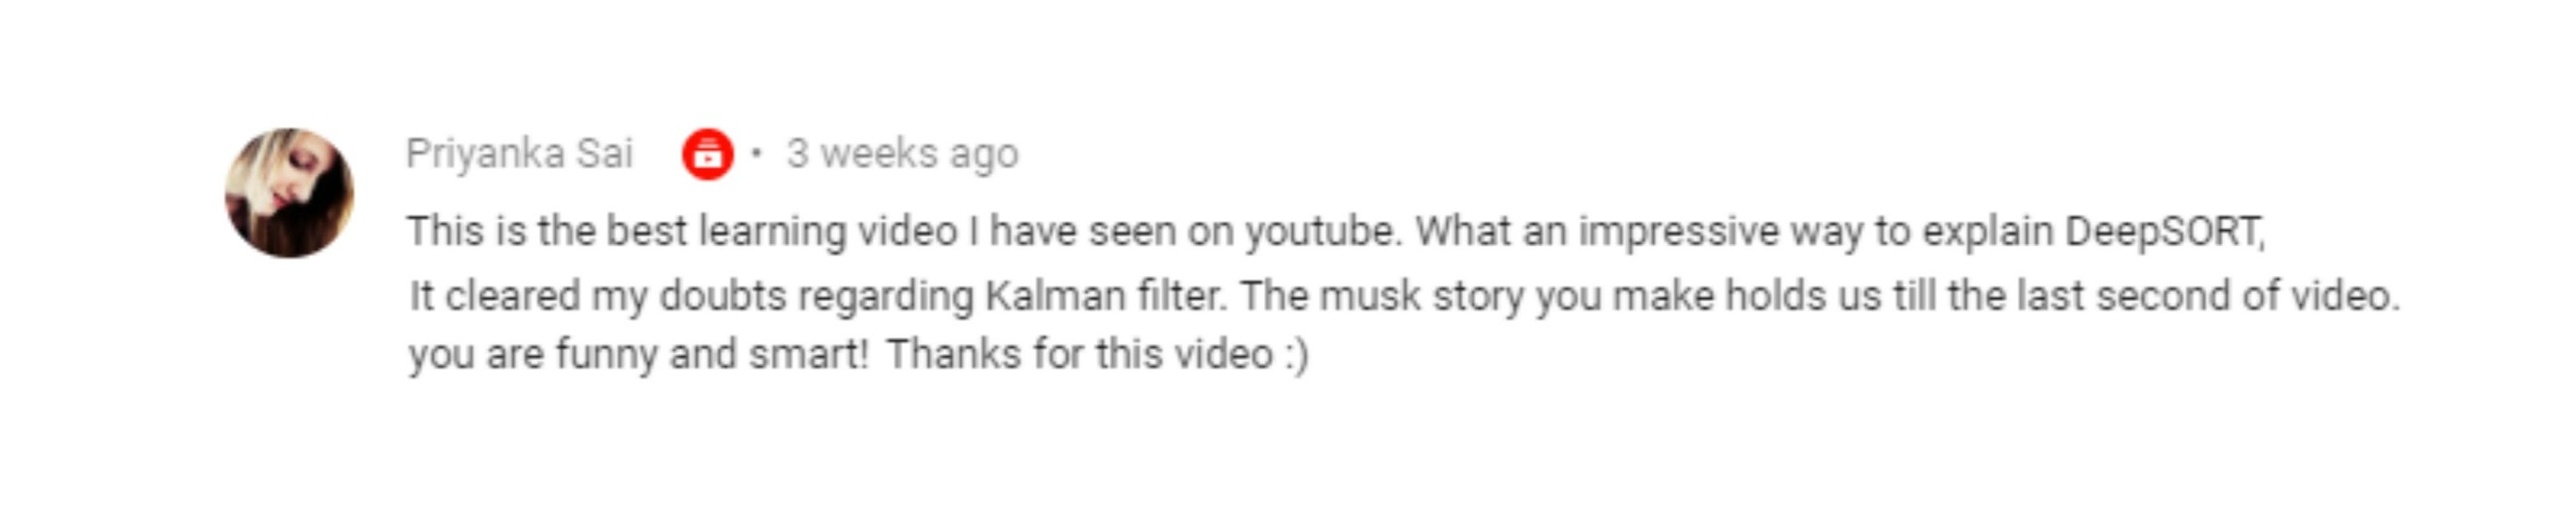
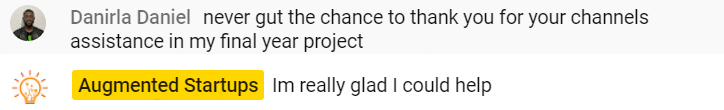
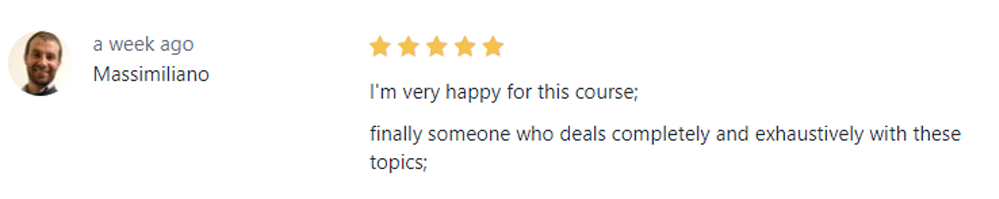
Testimonials