How To Create Good Computer Vision Dashboards?
Mar 04, 2022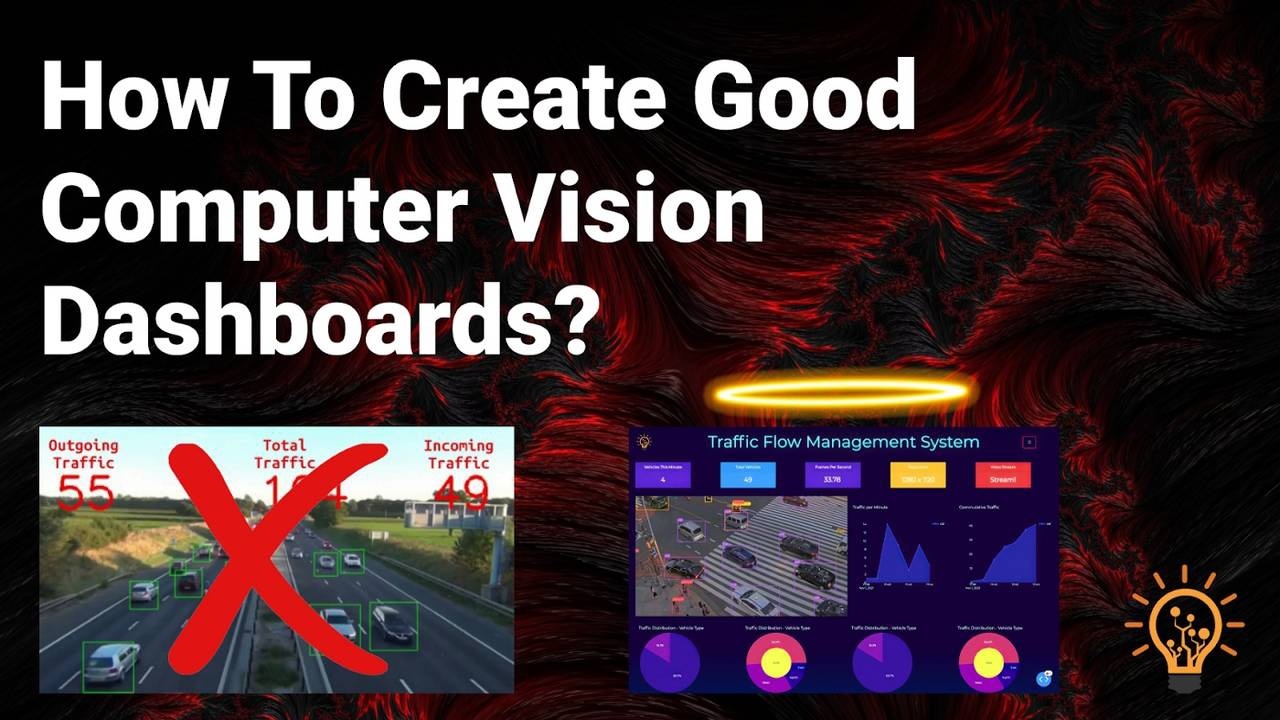
The insights and predictions of machine learning models are next to useless if they are not communicated effectively to relevant people in the organization. This is not a new problem, the analytics industry has been working on this for decades. The large slew of visualization and dashboarding tools created are a testament to this.
What’s The Need For Computer Vision Dashboard?
As artificial intelligence engineers, we often fall for the fallacy that leveraging computer vision to extract relevant information from videos/images is enough. This is simply not the case.
Depending on the use case you might need to analyze and extrapolate the data points. More importantly, you will need to present the data in a manner that is easy to read and that helps the end-user answer all relevant questions. This creates a need for good computer vision analytics dashboards.
Let’s understand the problem better with the help of an example. Our goal is to create a computer vision solution for monitoring traffic flow through a particular piece of road.
What do you think of the following solutions?
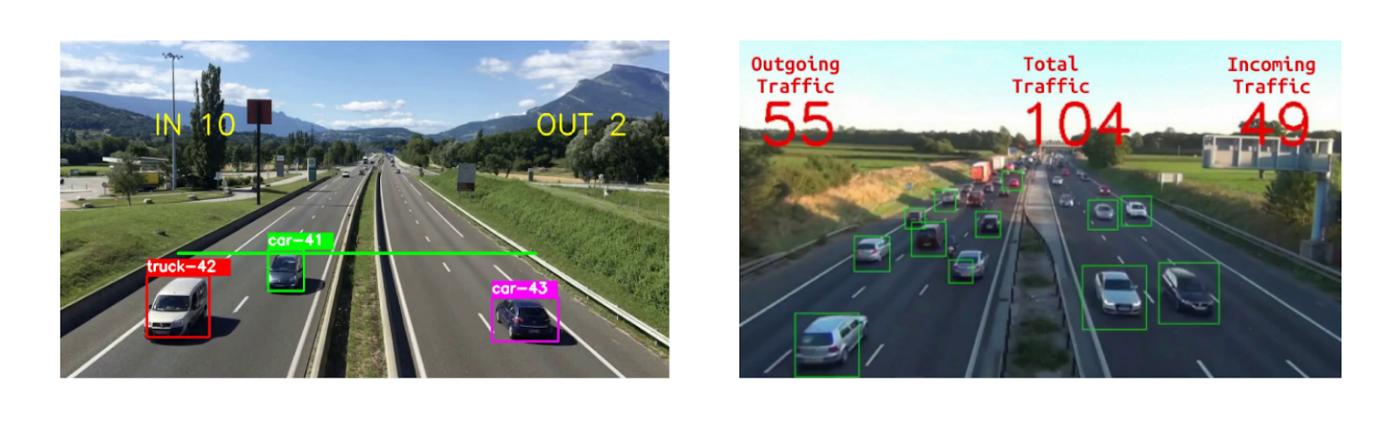
Although both these solutions tackle the core problems of detecting and tracking vehicles effectively, they leave a great deal to be desired.
Leave what? Doesn’t make sense?
Here, now take a look at these dashboards.
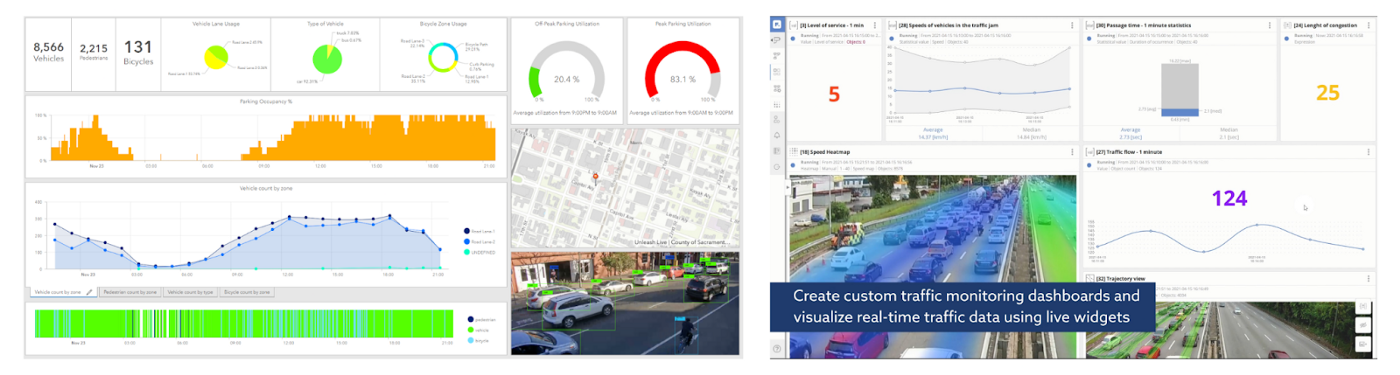
They use the same computer vision solutions in the backend but they do an exceptional job of utilizing and communicating the data points they extract.
Where in the first two solutions, you could only see the total number of vehicles since the beginning of the day. These dashboards provide plots and metrics that enable you to get a better understanding of the traffic flow throughout the day, in one glance.
Besides that, these dashboards have interactive elements that enable you to dig deeper into the data. The one on the right even goes above and beyond by visualizing the real-time traffic flow in the video feed itself.
Problems With Building A Computer Vision Dashboard
If you want to develop an end-to-end Computer Vision application, you have a choice between using third-party cloud service and developing it on your own.
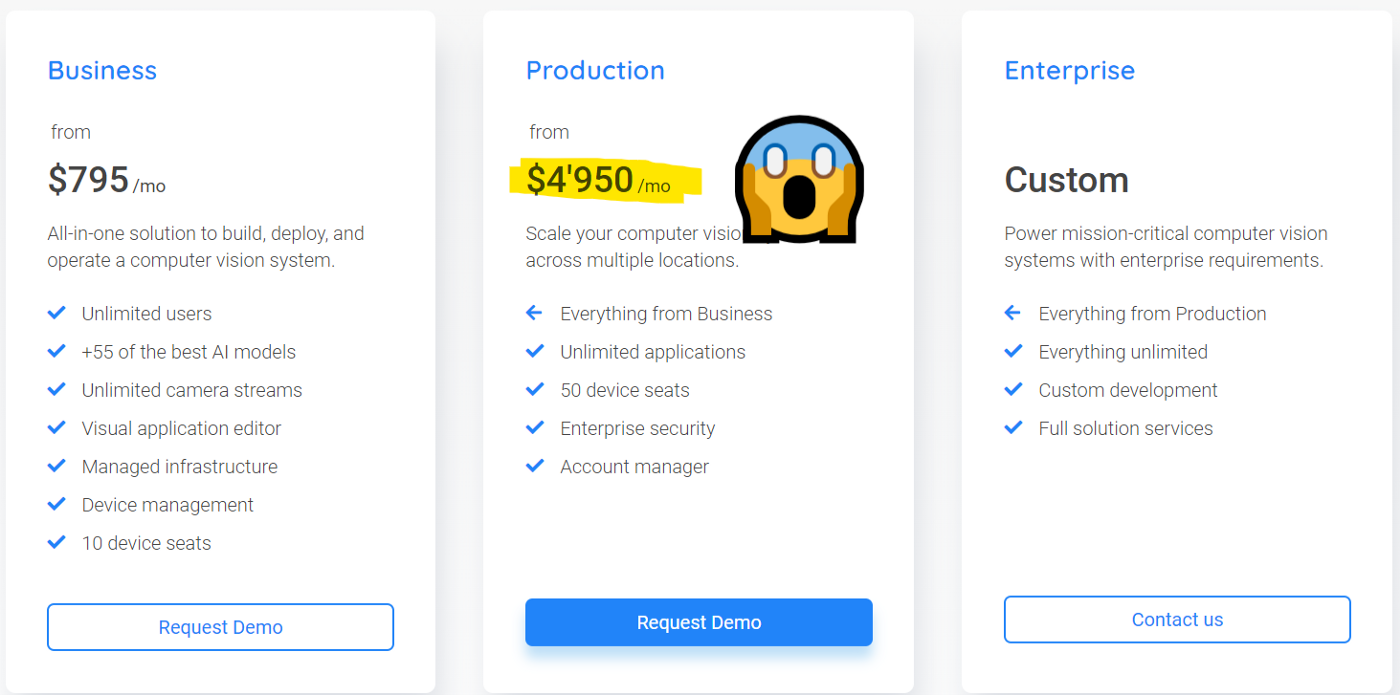
Although the third-party services provide you with the means to quickly build and deploy your applications, they come with their own problems. They are quite limited in terms of the available models that can become outdated rather quickly. Moreover, as the data is stored on someone else’s server there’s also the issue of data privacy. And let’s not forget about the expensive monthly costs. Consider viso for example, they have a whopping monthly price of nearly $5000!
Now that might deter you from using third-party services, let’s consider the alternative. Creating your computer vision application allows you to choose from the best available AI models, customize them as per your needs and deploy them where needed. There’s no problem with data privacy and no expensive costs. The only issue is that it’s hard, especially so if you don’t have any experience with dashboarding/development tools.
You see, even though there is a wide range of tools for creating dashboards and web apps, there are hardly any resources that talk about them in the context of computer vision.
And this over-abundance of tools presents a problem in itself- Analysis Paralysis.
So what’s the solution? Where do you start?
Presenting the YOLOX Pro CV Dashboard Course!
It is a live cohort-based course in which you’ll learn how to build a computer vision dashboard from the ground up. The course consists of five modules. The first module provides an introduction to object detection, YOLOX, and running YOLOX on different environments. In the second module, you’ll learn you train your own custom YOLOX model, and how to get optimal performance using our TOP SECRET PROCESS. You also learn about a tool that enables you to automate the tedious image annotation process.
Module three covers the basics of object tracking and customizing state-of-the-art tracking methods for your use cases. In module four you’ll integrate YOLOX and SORT to create 4 computer vision applications, and learn how to work with live RTSP and IP camera feeds.
Module five is where things get juicy! It will cover the tools required to build production-ready dashboards such as Plotly, Dash, HTML5, and Bootstrap.
You’ll implement and deploy a traffic analytics dashboard that will display key metrics in the form of graphs, charts, and interactable widgets.
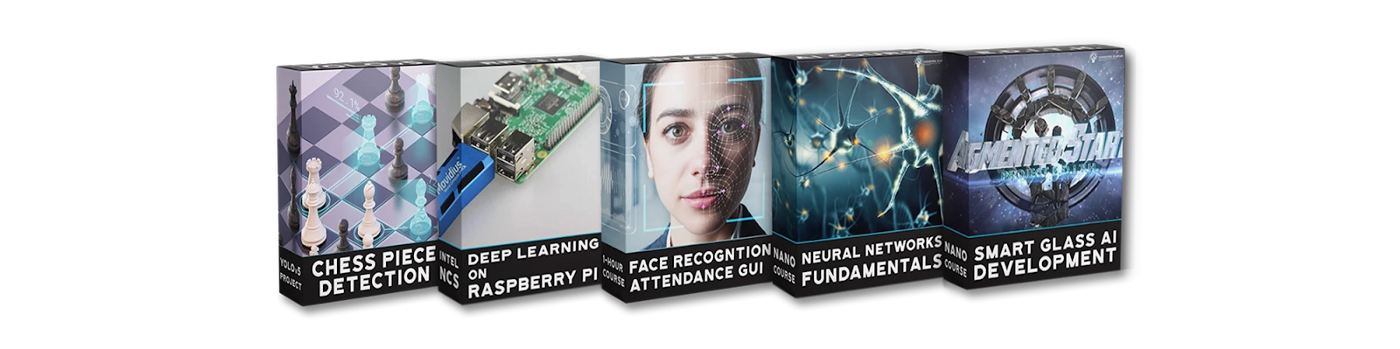
In addition to the course material, you’ll also get free roboflow training credits, bonus courses, live doubt clearing/technical support sessions.
So what are you waiting for?
Enroll here today!
From 80-Hour Weeks to 4-Hour Workflows
Get my Corporate Automation Starter Pack and discover how I automated my way from burnout to freedom. Includes the AI maturity audit + ready-to-deploy n8n workflows that save hours every day.
We hate SPAM. We will never sell your information, for any reason.